From record glacier melting to new health risks: how climate change is already transforming our lives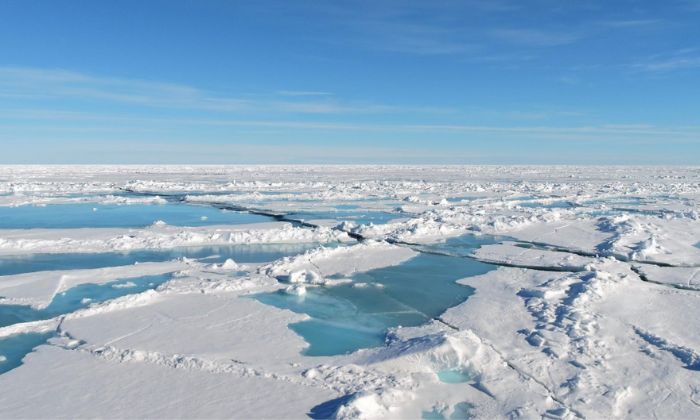
Record-low sea ice levels, extreme ocean warming, 2.33 billion people with limited access to food, and increasing health risks—the data from the World Meteorological Organization’s 2025 report outline changes on a global scale. The information is available online and through an interactive story map with maps and charts, allowing these processes to be explored visually and in detail.
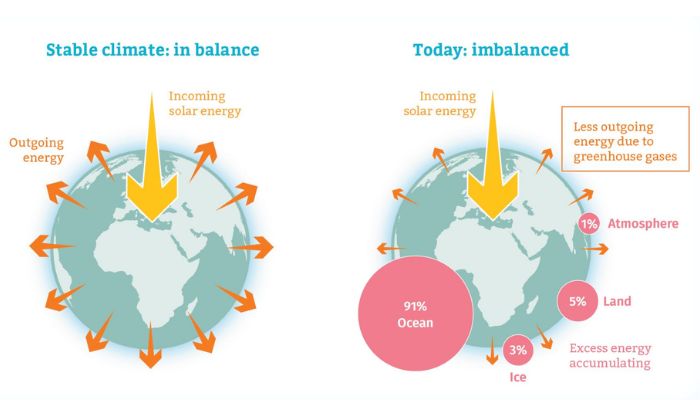
Temperature and energy imbalance
Global temperature in 2025 reaches approximately 1.43°C above pre-industrial levels, and the past decade is established as the warmest on record. This is not an isolated indicator, but the result of accumulated heat within the climate system.
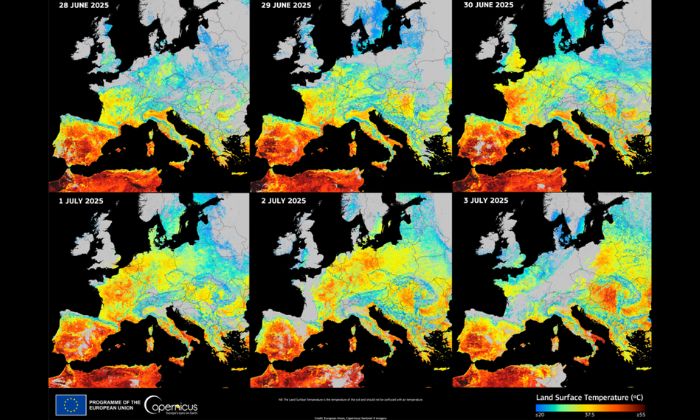
The amount of energy retained in the system reaches record levels. This imbalance underlies the other processes—from ocean warming to ice melt and changes in atmospheric patterns.
Ocean and sea level
About 90% of this additional heat is accumulated in the ocean, which continues to warm at record rates. This leads to the expansion of water masses and is a key factor in sea level rise.
The rate of this rise is accelerating—from about 2.65 mm per year in the period 1993–2011 to nearly 4.75 mm per year in recent years. Even these seemingly small values have significant consequences for coastal areas, infrastructure, and populations.
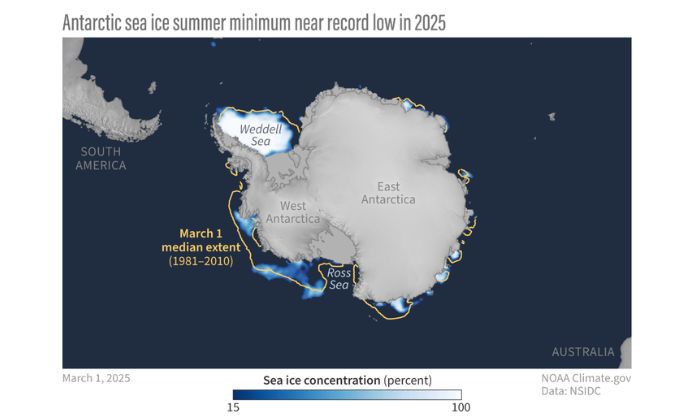
Glaciers and sea ice
Changes in global temperature directly affect the planet’s ice masses. In 2025, Arctic sea ice reached its lowest maximum extent on record, a clear indicator of accelerating warming in the polar regions.
In Antarctica, sea ice also remains at extremely low levels—one of the lowest minimum extents has been recorded, and recent years rank among the weakest in the entire satellite record.
At the same time, glaciers worldwide continue to lose mass at accelerated rates, with preliminary data indicating yet another year of strongly negative balance. This has a direct impact on water resources, ecosystems, and the livelihoods of millions of people.
Food security
One of the most direct impacts of climate change is on food production and access. Droughts, extreme precipitation, and temperature anomalies lead to unstable yields and increase pressure on agricultural systems.
According to estimates by international organizations, 2.33 billion people are already affected by moderate or severe food insecurity. This is not a local issue, but a global trend that affects economies, prices, and the resilience of food supply chains.
Impacts on health
Climate is also having an increasing impact on human health. Rising temperatures and changes in precipitation create conditions for the spread of diseases such as dengue.
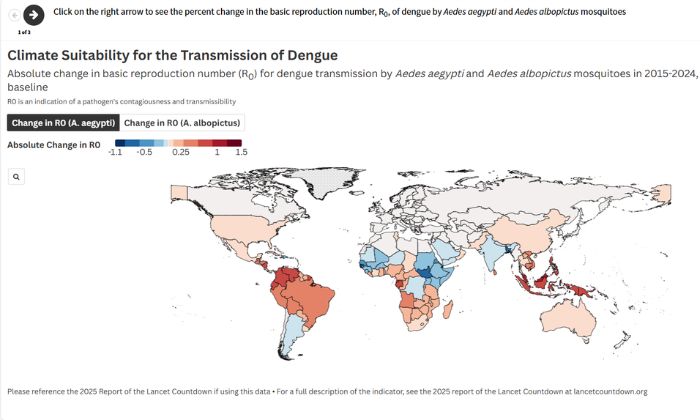
Today, around half of the world’s population is at risk, with the infection now occurring beyond its traditional tropical regions. In Europe, local transmission cases are being recorded, and the spread of vectors such as the Asian tiger mosquito is reaching new territories, including parts of Southeastern Europe.
Data in context
The interactive story map is created using Esri technology and brings together all these processes in a unified environment for analysis. Through maps, charts, and spatial layers, it allows both individual indicators and their interconnections to be explored.
This approach enables data to be examined in a real geographic context—to analyze trends, compare regions, and understand how global processes manifest at the local level.
###