The World Meteorological Organization has presented its 2022 annual climate report in visual form with an interactive GIS StoryMap.
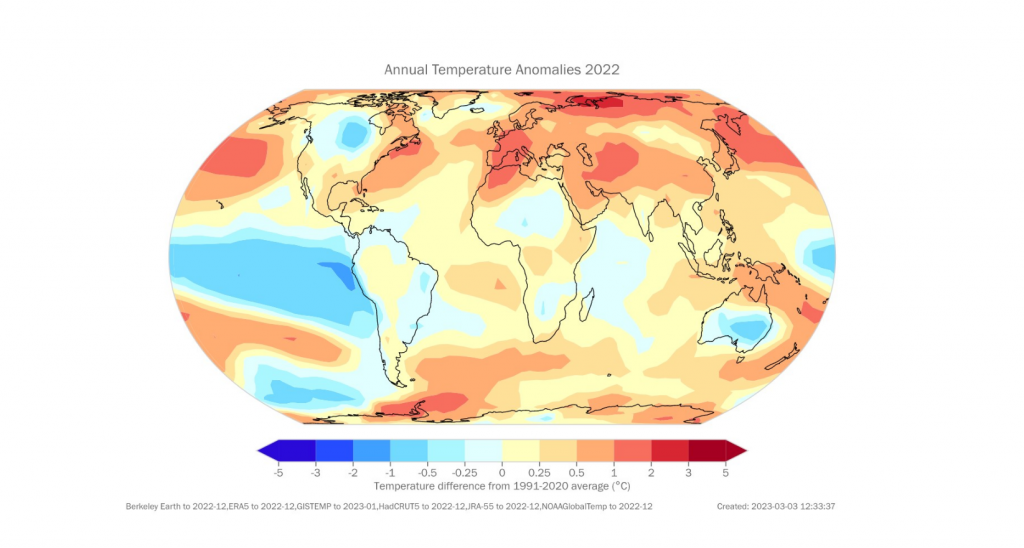
Sofia, 15 May 2023 – The past eight years have been the warmest on record, and the global average temperature in 2022 was 1.15 ± 0.13 °C above the pre-industrial period. This is clear from the annual report of the World Meteorological Organization (WMO) on the state of the climate for 2022.
WMO presented the highlights of the report in a web StoryMap created with the GIS platform of the global technology giant Esri. The StormMap visually shows with the help of interactive maps, diagrams, and videos the main values and trends for 7 key climate indicators.
The danger of reaching the critical average annual temperature increase of 1.5°C is increasingly real, which would lead to changes in the environment, biodiversity, etc., threatening the planet. Depending on the different data sources, the StoryMap states that 2022 was the 5th or 6th hottest year on record.
Carbon dioxide (CO2) is the greenhouse gas with the greatest environmental impact, followed by methane and nitrous oxide. In addition to increasing average annual temperatures, greenhouse gases cause ocean oxidation and warming, melting glaciers and sea ice, and rising global sea levels.
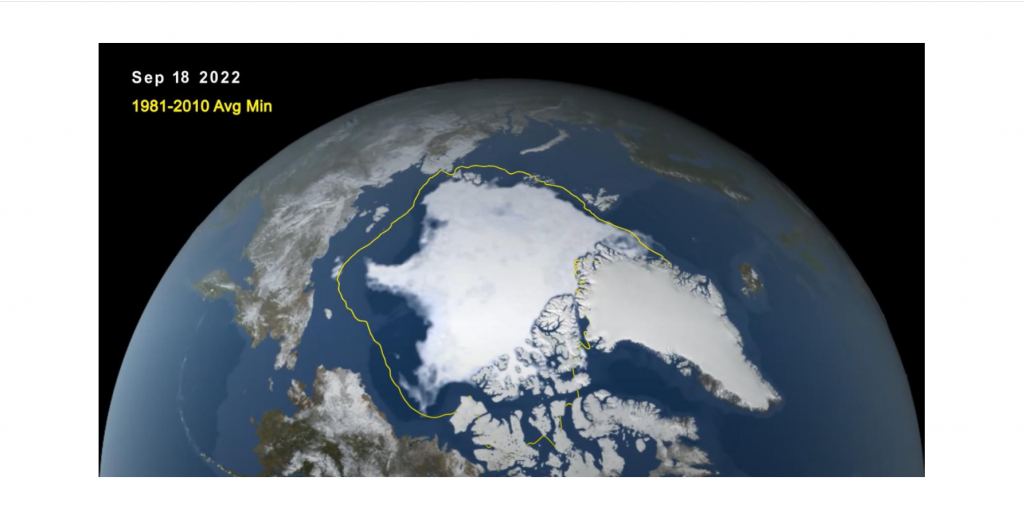
2022 saw the lowest ocean pH levels in at least 26,000 years. About 90% of the excess energy that accumulates in the Earth’s system due to increasing concentrations of greenhouse gases goes into the ocean. It is expected that the Ocean continue to warm in the future, a change that is irreversible on time scales of centuries to millennia. The consequences are highly negative for coral reefs and marine life, as well as for sea levels. Sea level has risen by about 180 mm from 1900 to the present day. The reason for this increase is the melting of ice and glaciers. The StoryMap also shows that the extent of Antarctic sea ice dropped to 1.92 million sq km on February 25, 2022, the lowest level on record.
The record melting of the ice in the Swiss Alps is also vividly and impressively presented – this is definitely one of the darkest records in the field of climate in the past year in Europe.
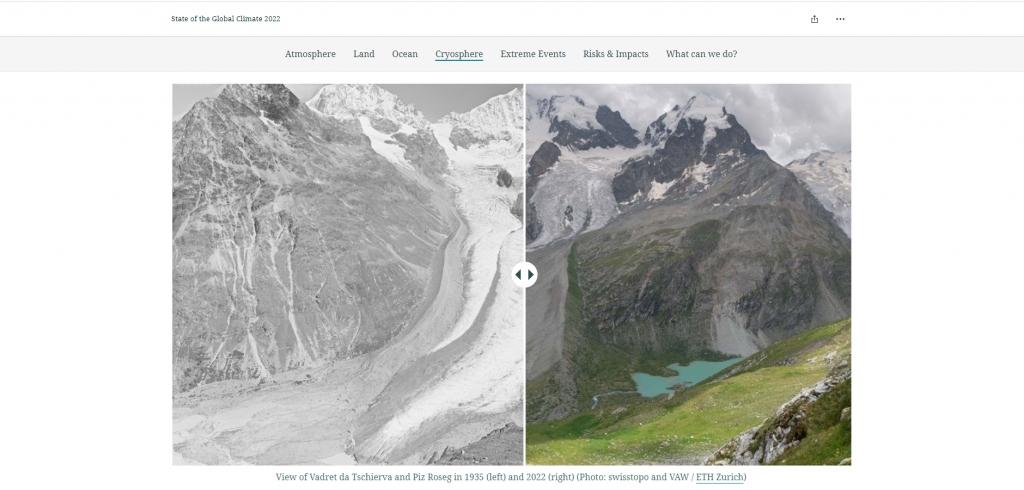
Nearly 40 of the glaciers monitored worldwide by the World Glacier Monitoring Service recorded mass loss in the period 1950-2022.
On an interactive Esri GIS map, as part of the StoryMap, are also visualized extreme natural phenomena such as droughts, floods, excessive heat, hurricanes, etc., which have occurred around the world due to climate change in 2022.
Along with the negative climate trends and statistics, the WMO also presents some registered positive changes, including an increase in the production of renewable energy sources. It has seen a significant increase over the last decade – the charts in the StoryMap show. Wind and solar, for example, reach a record 12% of global electricity in 2022.
More information about the report can be found on the WMO page.
Useful resources and information on the capabilities of GIS technologies for risk analysis and climate resilience can be found at: https://www.esri.com/en-us/about/climate-change/overview
###